
Reading lab reports
DSIP lab report: what to check
NuuVive Journal · · 6 min read

Short answer
To read a DSIP lab report, first check that the lot number matches the printed label and the laboratory is a named, verifiable facility. Then, confirm the mass spectrometry (MS) results match DSIP's theoretical molecular weight of 848.81 g/mol to prove identity. Finally, check the high-performance liquid chromatography (HPLC) trace to ensure the main peak accounts for the claimed purity percentage, bearing in mind that chromatographic purity does not equal total peptide content by weight.
Key takeaways
- A valid lab report must feature a specific lot number that matches the printed label on the glass.
- High-performance liquid chromatography (HPLC) measures purity by peak area but cannot confirm what the molecule actually is.
- Mass spectrometry (MS) is mandatory to confirm the molecular weight matches DSIP's expected 848.81 g/mol.
- Chromatographic purity is not net peptide content; lyophilised powders contain residual moisture and salts alongside the target peptide.
- Reports missing a clear test date, a named laboratory, or analytical method details are decorative, not evidence.
The anatomy of a trustworthy certificate
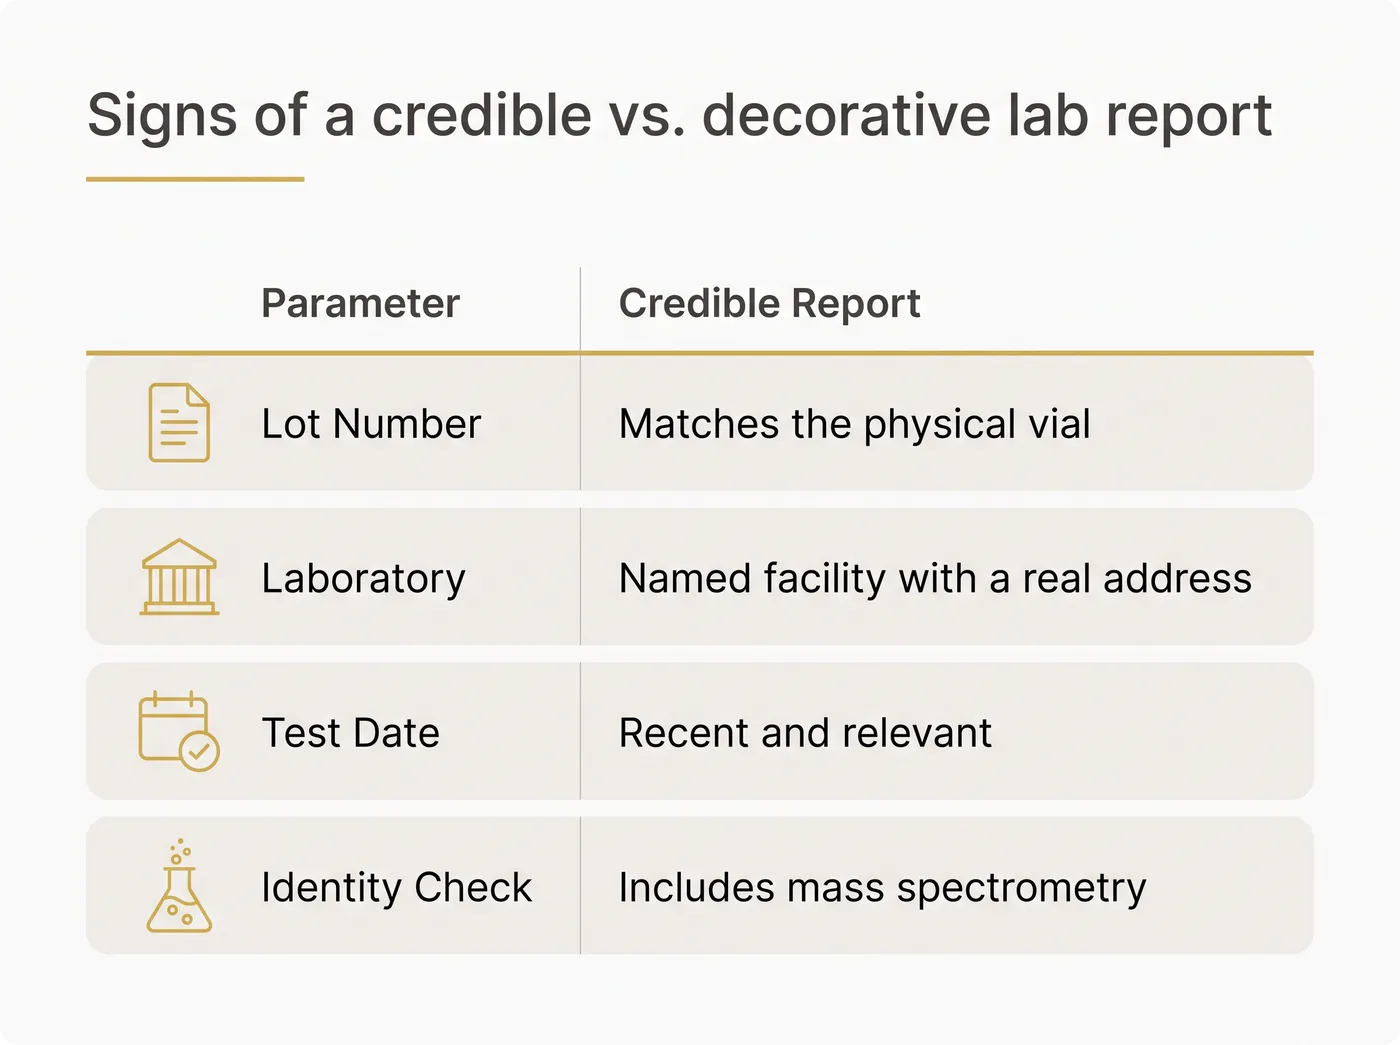
Somewhere between clicking a button on a website and a small box landing on your desk, a PDF does a lot of heavy lifting. It is the sole document telling you the white powder in that glass vial is what the label claims. Before you get distracted by the large purity percentage stamped at the top, spend thirty seconds scanning the header. That is where vague certificates quietly give themselves away.
The foundation of any analytical document is traceability. A certificate must name a specific lot, and that string of characters should match the number printed on the vial perfectly. Without a lot number, the report describes some material tested at some point in the past, and absolutely nothing ties it to the physical item being tested. Regulatory guidelines dictate that a lot number must be a distinctive combination of letters and numbers from which the complete history of manufacture can be determined 7.
Next, look for the laboratory details. "An independent accredited laboratory" sounds fantastic right up until you realise it names nobody and provides no address. A credible certificate lists the facility that ran the analysis, allowing anyone to verify their existence. Finally, check the test date. A three-year-old report on a batch sold today is a bit like a restaurant proudly framing last decade's hygiene inspection. Good manufacturing practice standards mandate proper batch records and laboratory controls 5, meaning current batches need current data.
HPLC: measuring the crowd
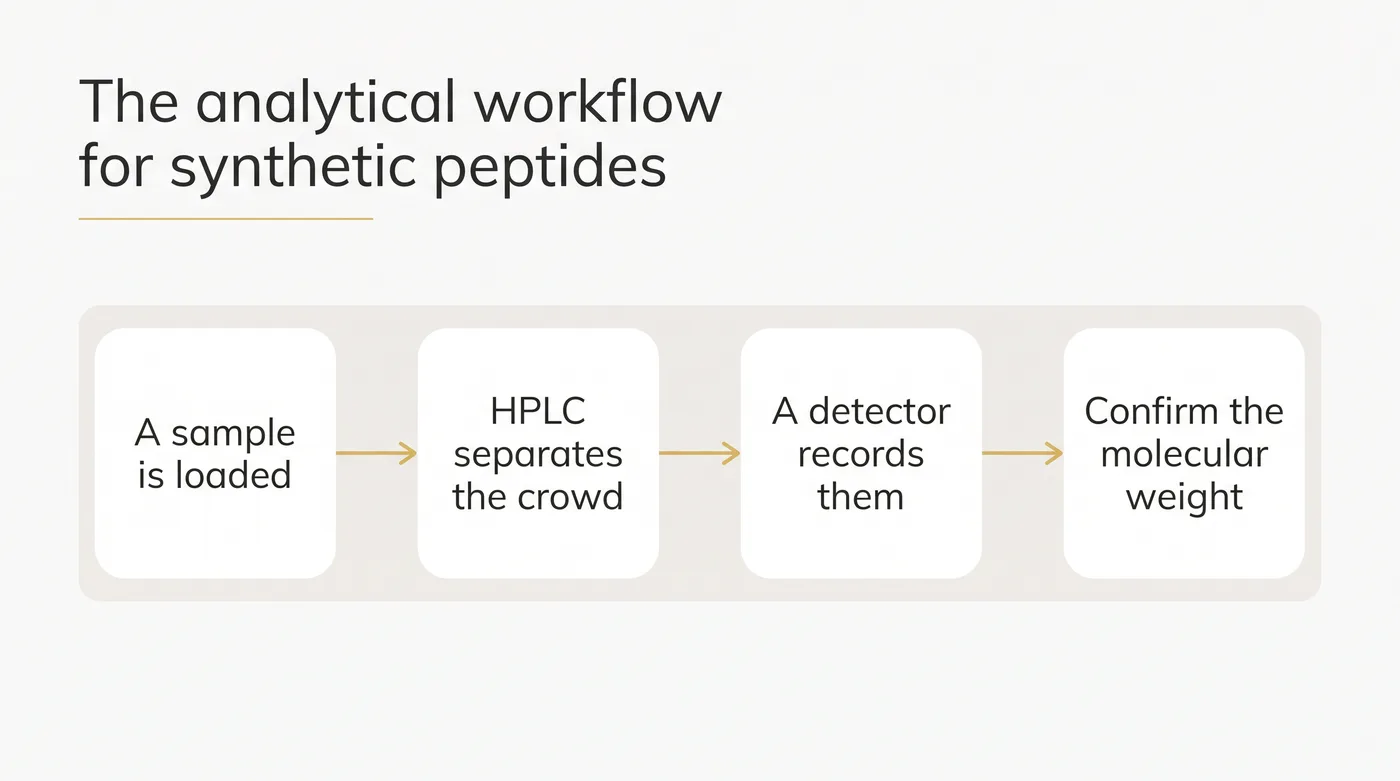
When you look at a certificate of analysis, the first graph you usually see is the high-performance liquid chromatography (HPLC) chromatogram. Think of an HPLC column as a highly selective obstacle course. A sample is loaded into the system, and a liquid mobile phase pushes it through a tightly packed column. Different molecules move through the obstacles at different speeds. As they exit the column, a detector records them, drawing a peak on the graph.
DSIP, a linear nonapeptide with the sequence Trp-Ala-Gly-Gly-Asp-Ala-Ser-Gly-Glu, contains a Tryptophan (Trp) residue at its N-terminus. This residue is a strong chromophore, meaning it absorbs ultraviolet light brilliantly, making it easy for the HPLC's UV detector to spot. The area under the main peak is compared to the total area of all peaks combined, giving the chromatographic purity. If the main peak is 98% of the total area, the purity is reported as 98%.
However, reversed-phase HPLC is incredibly sensitive to the mobile phase chemistry and the gradient used 8. Laboratories typically use trifluoroacetic acid (TFA) as an ion-pairing reagent to keep the peaks sharp. While HPLC is excellent at telling you how many different things are in the sample and in what relative amounts, it has a massive blind spot. It only records the time a molecule exits the column (retention time). A beautifully sharp, 99% pure peak on an HPLC-UV trace does not prove the peak is DSIP. It only proves that 99% of the sample is the same unknown thing.
Mass spectrometry: proving the identity
This is where mass spectrometry (MS) becomes non-negotiable. If HPLC separates the crowd, MS asks for everyone's passport. An MS detector measures the mass-to-charge ratio (m/z) of the molecules exiting the chromatography column. By looking at the mass spectrum, analysts can confirm whether the main peak in the HPLC trace actually matches the theoretical molecular weight of the target peptide. For a practical example of checking molecular weights on a certificate, walk through how to read an Adamax lab report.
DSIP has a free base molecular formula of C35H48N10O15, giving it an average molecular weight of 848.81 g/mol. When you review the MS section of a lab report, you are looking for a dominant signal that aligns with this mass. Because electrospray ionization often adds a proton (H+) to the molecule, you will frequently see a peak at 849.8 (M+H). If the mass is wrong, it does not matter how pure the HPLC peak is; the vial contains the wrong material. For a closer look at how these numbers come together, explore the technical breakdown of the DSIP molecule.
Mass spectrometry is also how laboratories unmask synthesis failures. A missing amino acid from incomplete coupling, or an extra oxygen atom from oxidation (adding 16 Daltons), will show up clearly on a high-resolution mass spectrum. Accepting an HPLC-UV chromatogram as proof of quality without an accompanying mass spectrum is an analytical leap of faith best avoided. You can see similar structural identity verification principles when reviewing documents for structurally related linear peptides like Selank.
The purity trap: area percent vs. net content
There is a common misunderstanding that trips up even careful readers: confusing chromatographic purity with net peptide content. When a lab report states a purity of 99%, it means 99% of the UV-absorbing material detected by the HPLC is the target peptide. It does not mean the vial is 99% peptide by weight.
Synthetic peptides are manufactured and lyophilised as salts, not as naked molecules. DSIP is generally supplied as an acetate or trifluoroacetate (TFA) salt. These counterions add mass to the bulk powder. Alongside the salt, lyophilised powders hold onto residual moisture. Consequently, the actual Net Peptide Content (NPC) of the solid powder is usually between 70% and 85%.
HPLC cannot measure these invisible salts and water molecules because they do not absorb UV light at the wavelengths used for peptide detection. A powder with an 80% NPC means the peptide accounts for that proportion of the mass, with moisture and salt making up the remainder. The 99% purity figure only applies to the peptide fraction of the material. Understanding this distinction is important when comparing different batches or reading thorough documentation like a lab test guide.
Validation of these analytical procedures ensures the method measures what it is supposed to measure with acceptable accuracy and precision 3. When evaluating materials, always look for the hard data linking the lot to the analysis. To see how these verified analytical results look in practice, check the current lot reports and measured purity on NuuVive's DSIP.
Questions
Why does the MS show a mass slightly higher than 848.81?
Mass spectrometry typically measures ions. In electrospray ionization, the peptide gains a proton (H+), adding roughly 1 Dalton to the mass. Therefore, you will often see a primary peak around 849.8 m/z instead of the exact neutral mass.
Can a report be trusted if it lacks an MS graph?
No. HPLC alone only proves that the sample is uniform, not what the molecule actually is. Without mass spectrometry, there is no proof that the highly pure peak is actually DSIP.
What does a TFA salt designation mean on the report?
It means the peptide was lyophilised with trifluoroacetic acid counterions to form a stable solid. This is standard in synthetic peptide manufacturing, but it means the salt accounts for a portion of the total powder weight.
Why does the test date matter?
Peptides can degrade over time if exposed to heat or moisture. A recent test date ensures the purity shown on the certificate reflects the current state of the lot being sold, rather than its state years ago.